 Visualizing neural networks
- 5 mins The Project: Visualizing neural networks
This post summarizes the research, design, and implementation phases of my master’s project in visualizing neural networks. If you’re eager to skip ahead, check out the final product here: aimeeb-visualize-rnns.herokuapp.com.
Project Overview
The Algorritmo project seeks to answer the question “Can computers create art?” For my final master’s project, I collaborated with the Barecelona Supercomputing Center (BSC) on an exhibit featuring Algorritmo at Sónar, a 3-day electronic and advanced music festival. Algorritmo is a word-play on rhythm and algorithm, and thus translates to Algorhythm - clever, right?
Representing complex ideas visually helps to communicate those complex ideas to others. My final project would be an interactive and explanatory visualization, using D3.js, of the recurrent neural network algorithm, being used by the team at BSC to create new music.
This post summarizes the 3 phases of the project: research, design, and the final product.
Part 1: Research
The literature review and research phase is most completely detailed in my final paper.
The highlight of the literature was Visualizing and Understanding Convolutional Networks, Zeiler and Fergus. This team developed deconvnets: inverted trained neural networks which enable visualization of what the trained network has learned at different layers. Analysis of the deconvnet visualization enabled them to make modifications to the original popular AlexNet which improved single-model results 1.7%.
Additional references which were key in developing an understanding of recurrent neural networks:
- Understanding LSTMs, Christopher Olah
- The Unreasonable Effectiveness of Recurrent Neural Networks, Andrej Karpathy
- LSTM implementation explained
Part 2: Design and Development
A simple example
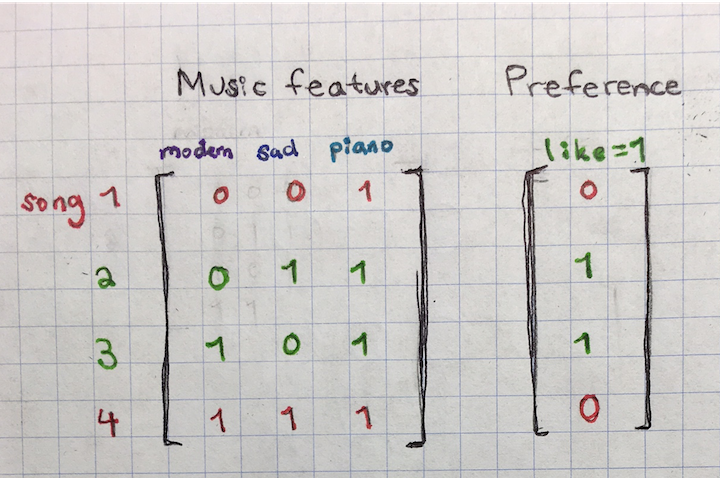
The easiest way to start developing an understanding of how neural networks learn is to start with a toy example: Say we want to find new songs for a Pandora customer, let’s call the customer Ben Folds. We want to understand if Ben will like or dislike a song based on just 3 song features:
- Is it modern?
- Is it sad?
- Does it include piano?
The first sketch shows our existing “training” data on 4 songs for Ben Folds. Ben Folds likes 2 of the 4 songs and dislikes the other 2. Can this information help us predict if he will like other songs based on the same 3 features?
If we visualize this data in a plot, we can see that the training data we have so far will make it hard to predict what Ben Folds will like.
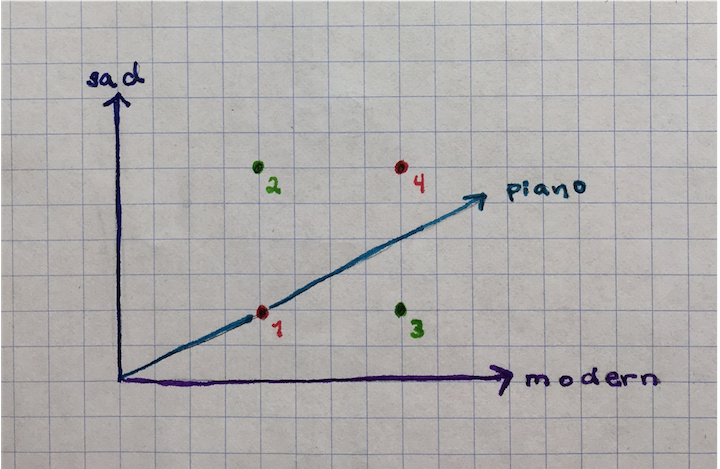
We want to learn some rules which will enable Pandora to queue new songs that Ben Folds will like. Unfortunately, no rules can be learned from this data set:
- All 4 songs have piano, so this feature is not helpful at all.
- Ben Folds likes one of the sad songs, but he dislikes the other sad song.
- Ben Folds likes one of the modern songs, but he dislikes the other modern song.
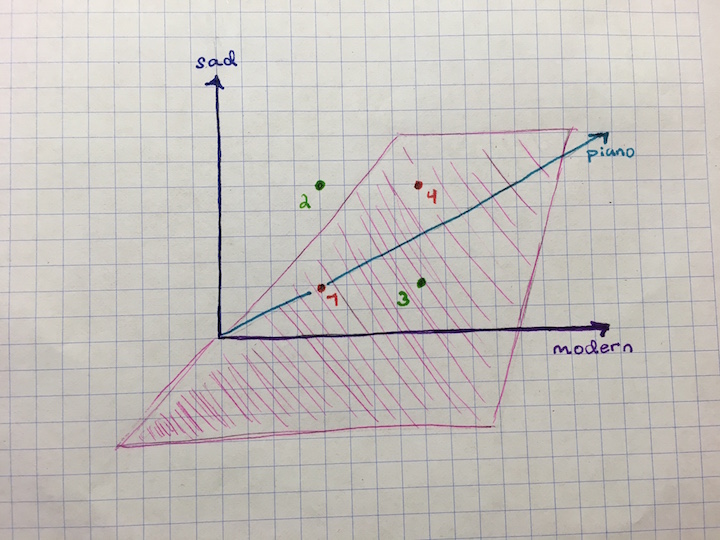
Learning a decision boundary
With better training data, the neural network learns a “decision boundary”. A decision boundary can be thought of as a set of rules which enable us to make predictions as to a certain outcome - for example if Ben Folds will like a new song. A decision boundary would have the majority of liked songs on one side and a majority of disliked songs on the other side.
How does a neural network learn where to put the decision boundary? Outputs of the training data are represented via 0’s and 1’s in our toy example - 1 means Ben Folds likes the song, 0 means Ben Folds dislikes the song. In addition to the outputs, we have the inputs as 0’s and 1’s indicating features present in each song, and a set of weights. The set of weights is initialized as a set of random numbers and one weight is associated with each feature of the data. In our toy example we have 3 weights because we have 3 features: modern, sad, piano.
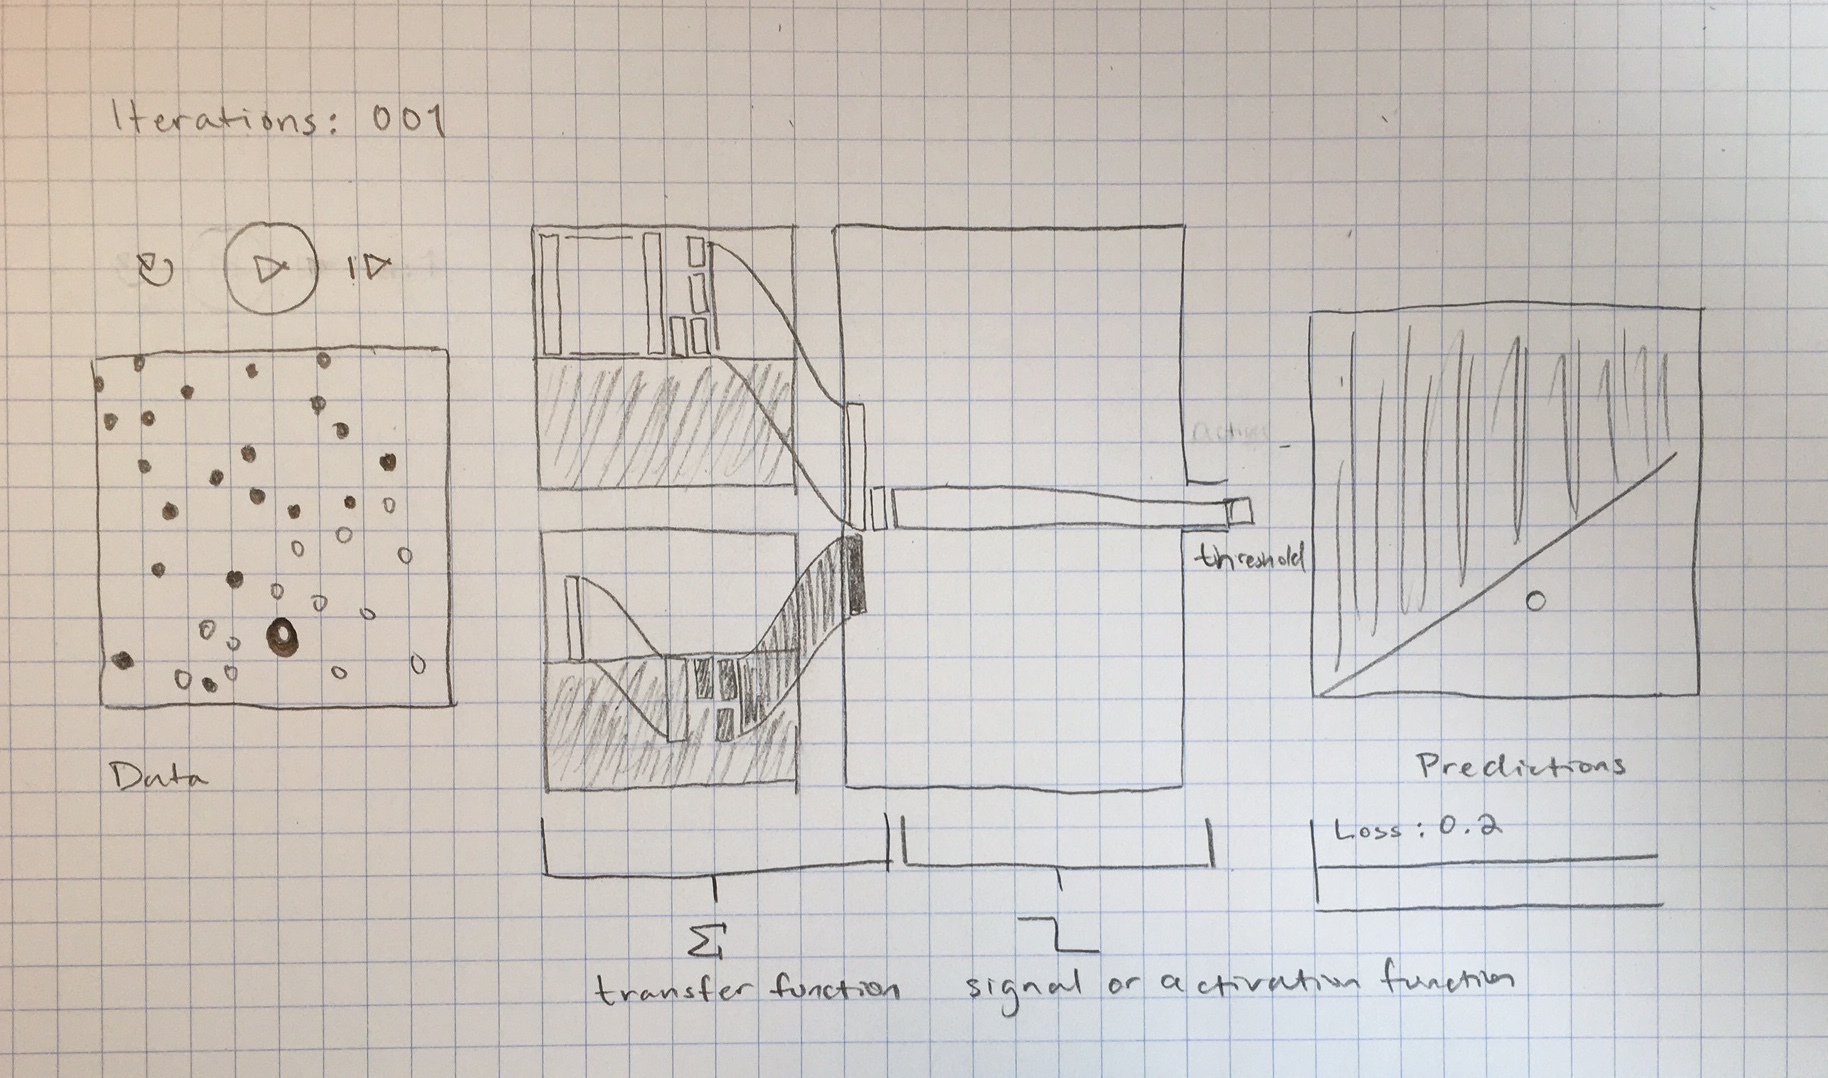
The first iteration of the neural network algorithm uses the random weights to make song preference predictions for Ben Folds. Based on how wrong the predictions are (this is called the “loss”), the algorithm adjusts the weights up or down. For example, if the set of weights first weighted piano heavily and the first song featured piano but Ben Folds hates that song, the weight corresponding to the piano feature would be reduced.
Below is a representation of the steps of this process in a computational graph:
Coding simple neural networks
The best way to ensure you really understand an algorithm, is to code it.
- Simple Sigmoid Classifier
- Simple Recurrent Neuron, using beer.stackoverflow.com text data
- Simple LSTM Neuron
Sketches
With a grasp on how neural networks work, I could start a design for the interactive visualization.
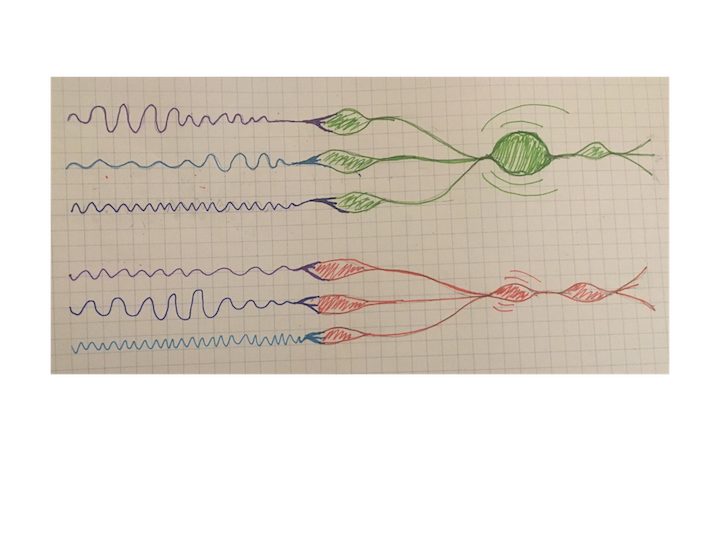
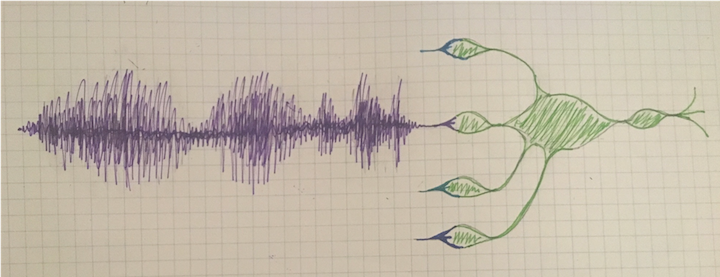
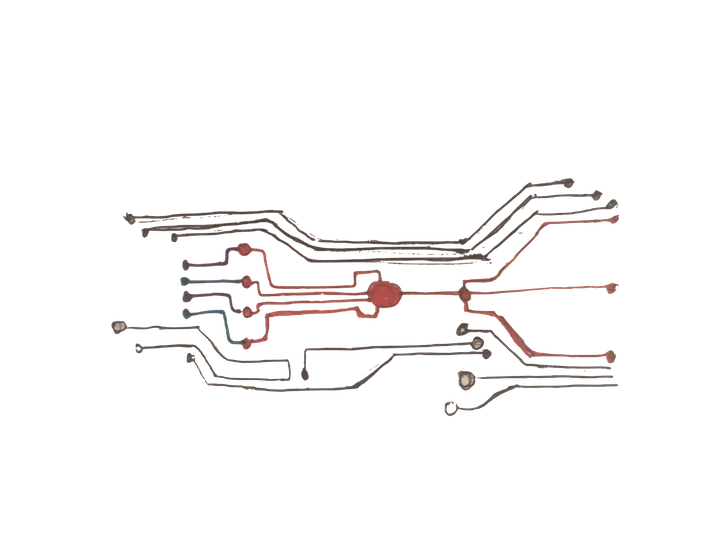
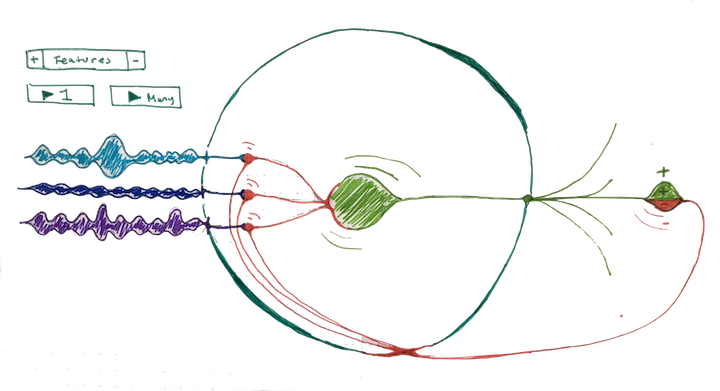
I sketched out multiple options for my colleagues to vet. I took inspirations from others exploring neural network visualizations and related concepts, like neurons, brain waves and circuits, find a subset of sketches below:
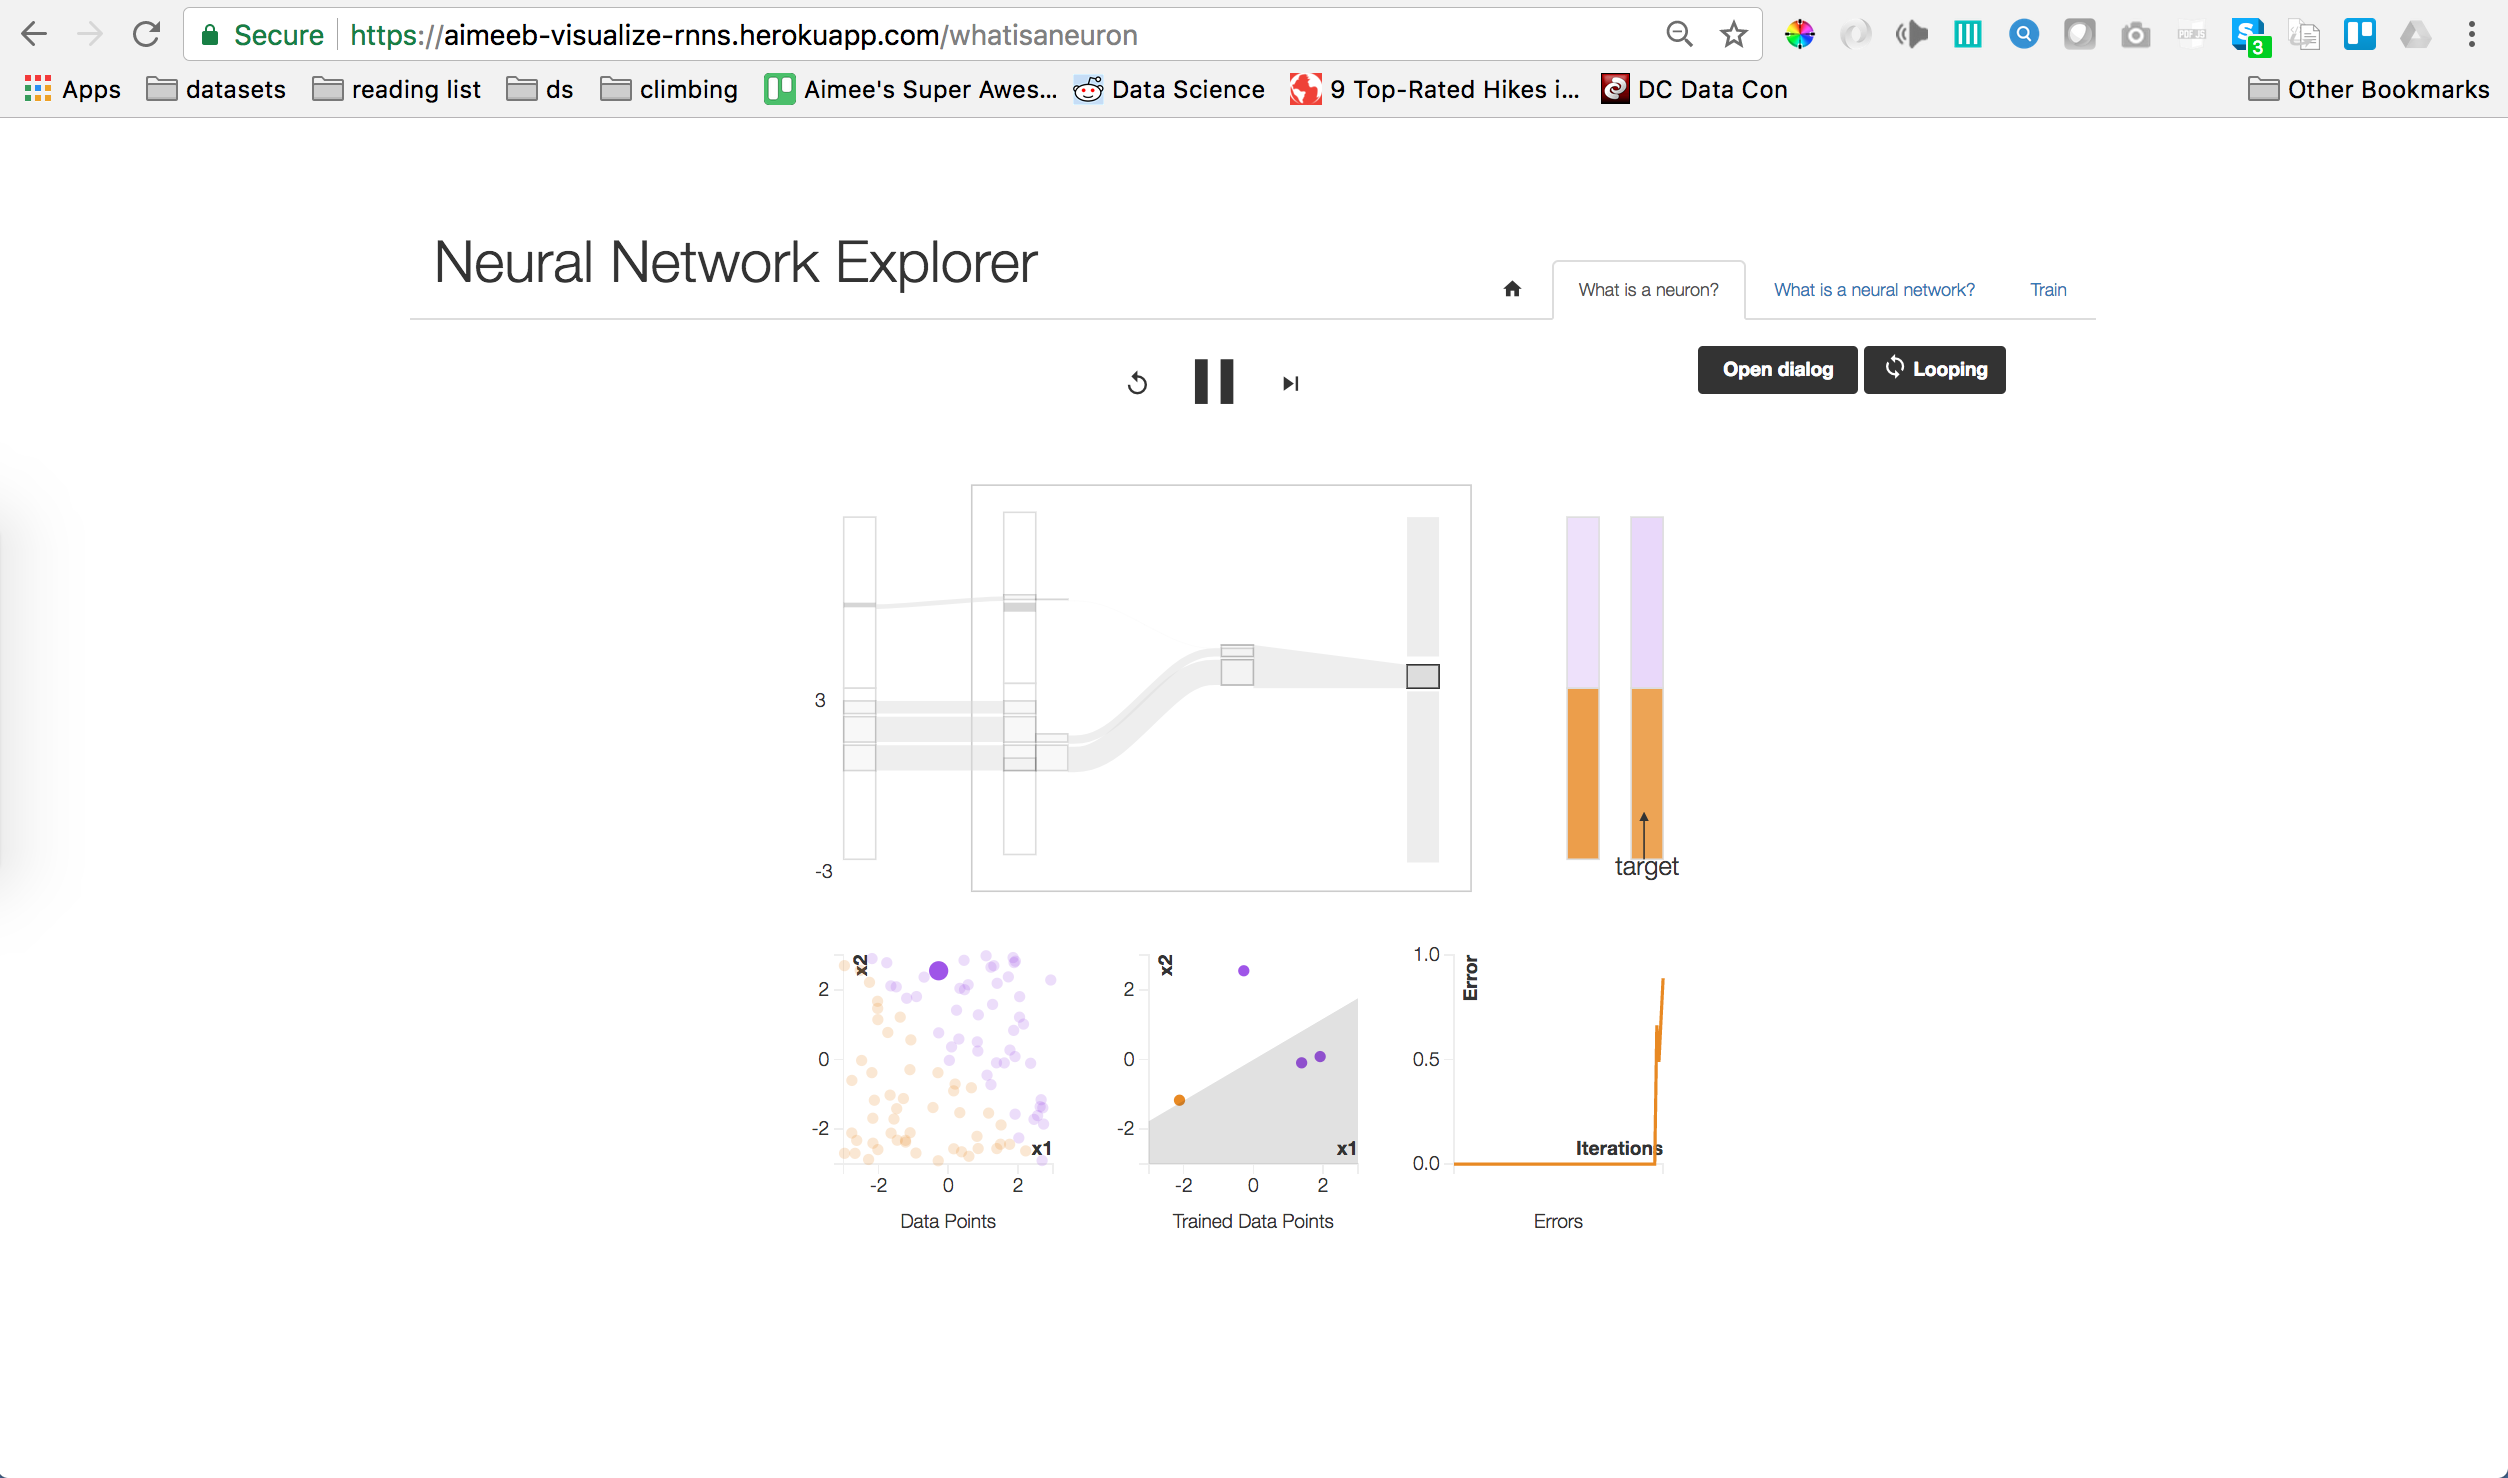
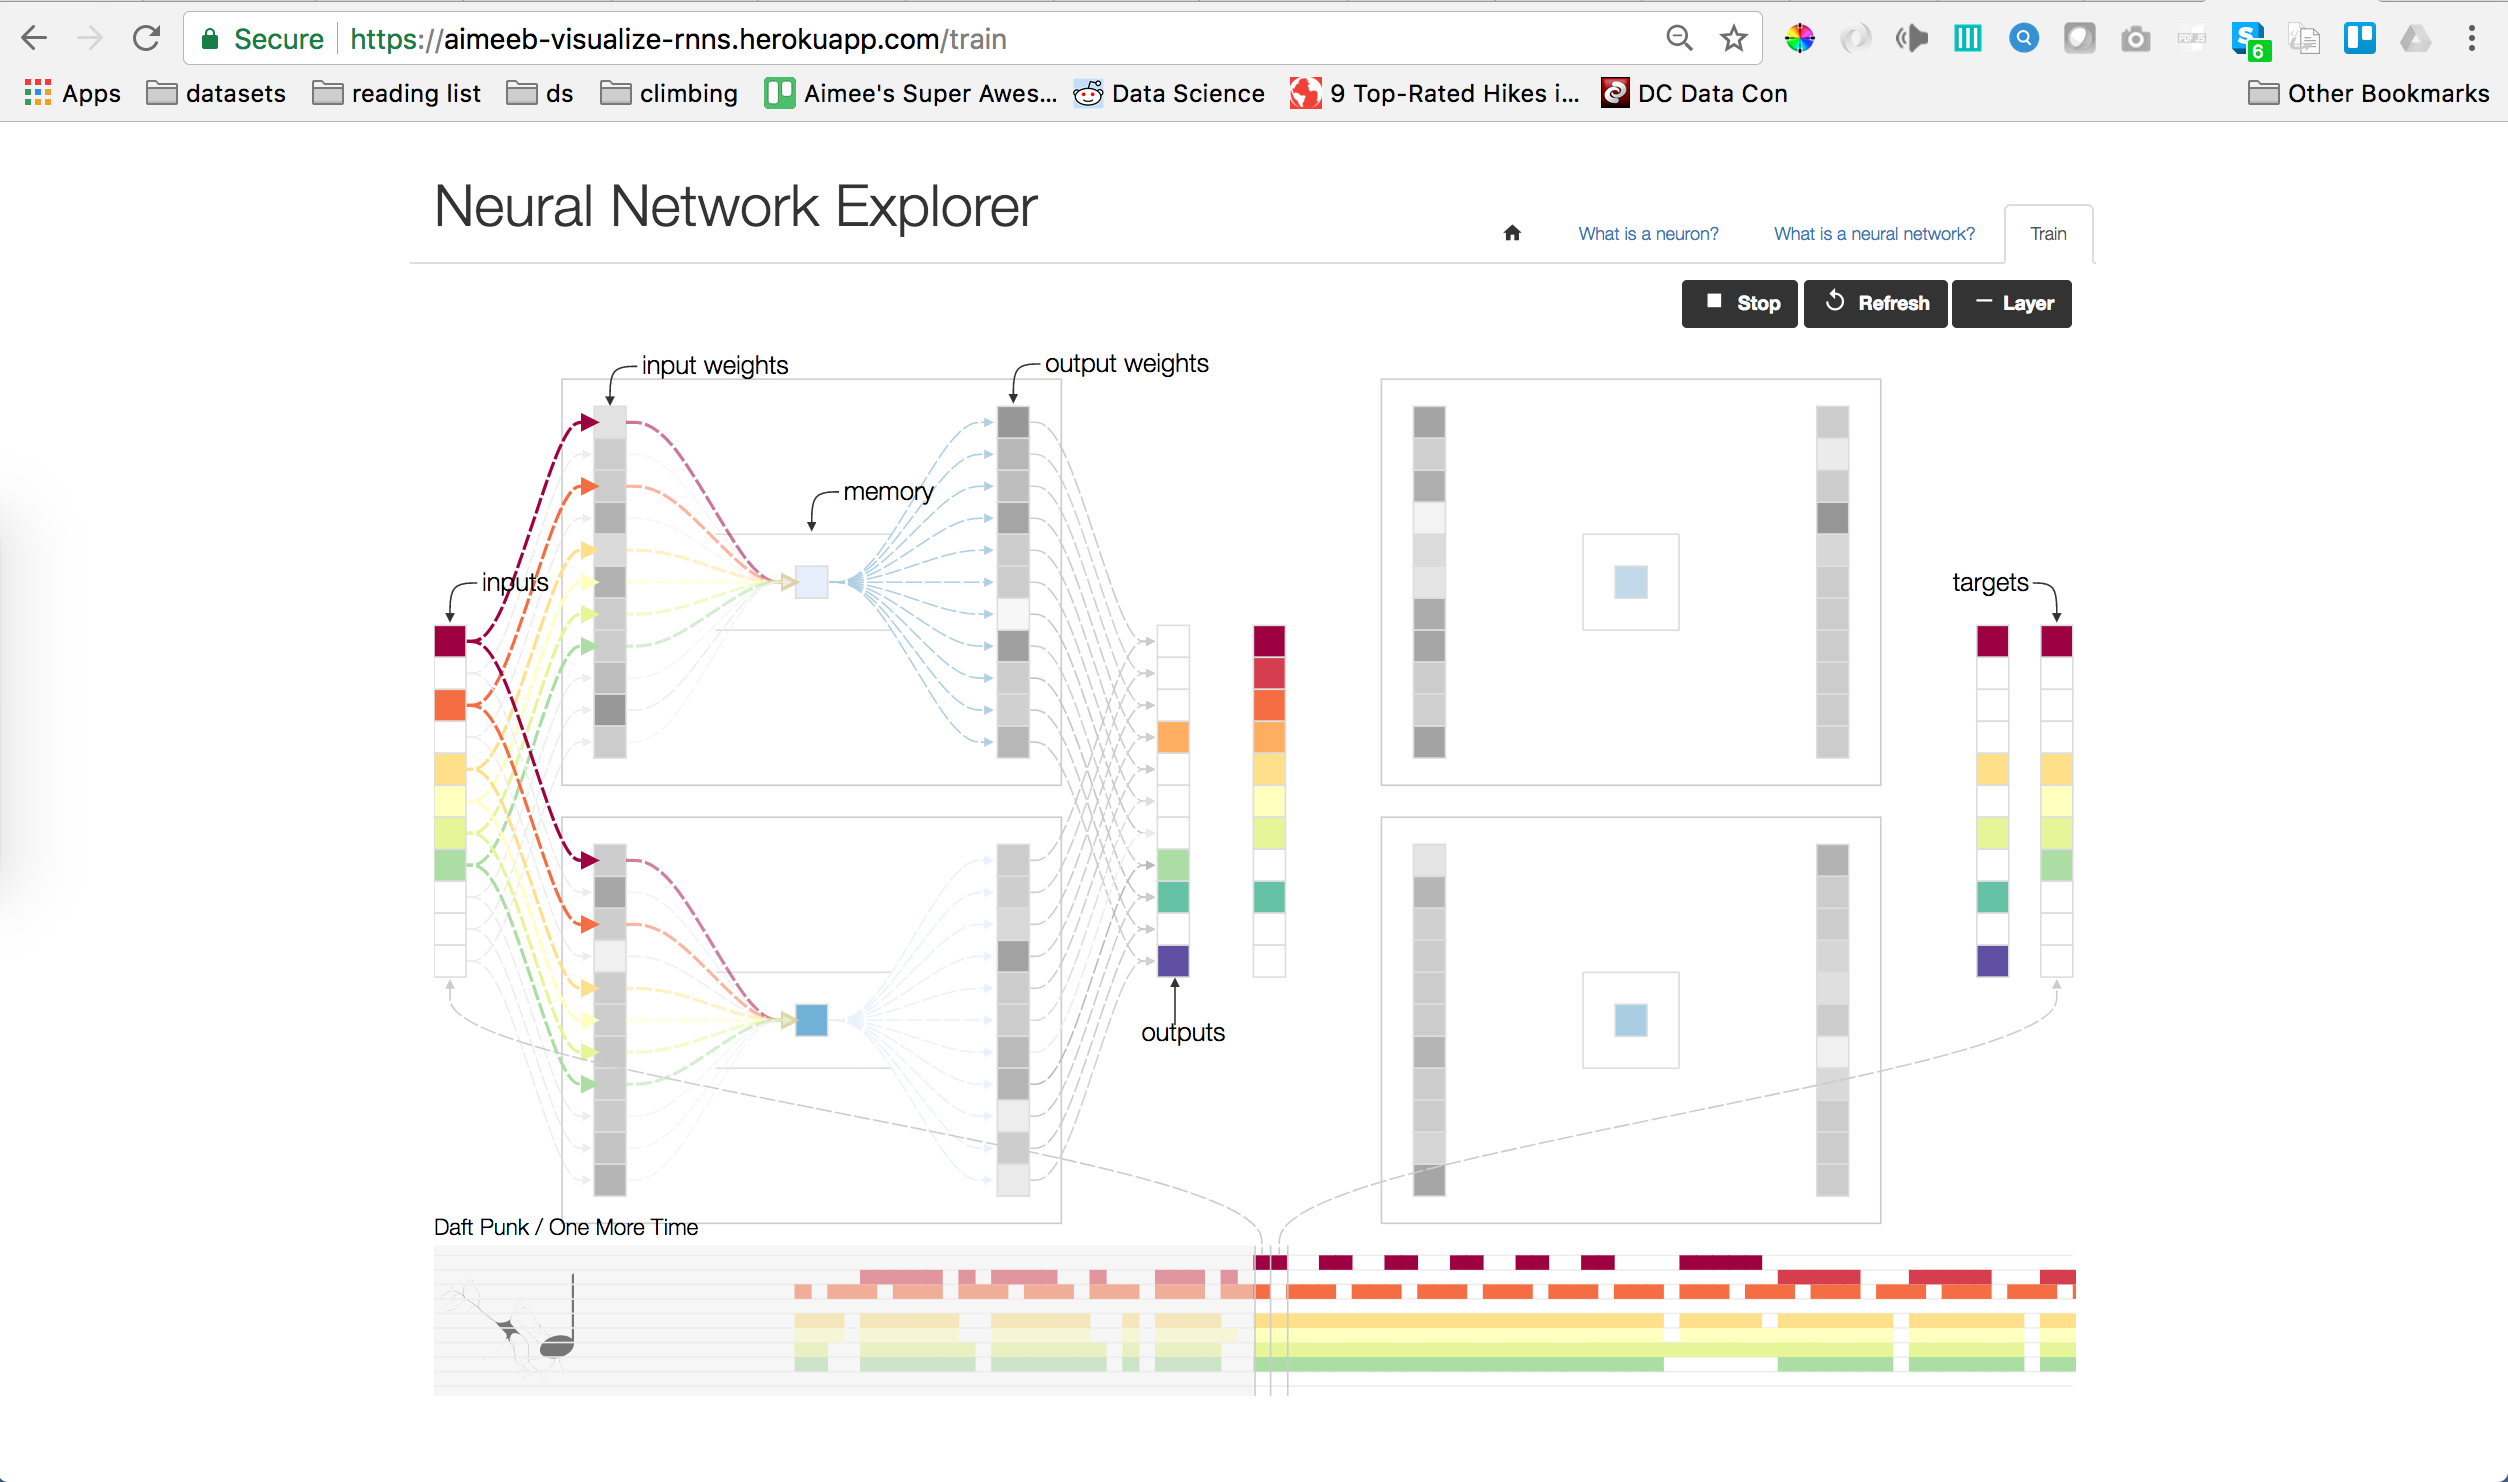
Part 3: The Final Product
The final product is hosted at aimeeb-visualize-rnns.herokuapp.com, and I encourage you to try it out yourself! Feedback is always welcome.
The project is most fully detailed in this paper and is summarized in this presentation.